
THE EVIDENCE
Students who ran Missions pulled ahead. Measurably.
Don’t take our word for it. Here’s what independent researchers found, and what it means for your students.

ESSA Level IIModerate evidence (2026)
- Validated by
- Instructure, June 2026
- Level II indicators
- 10 of 10 met
- Funded by
- U.S. Department of Education’s Institute of Education Sciences
In plain English
They learned more
Out of every 100 test questions, students who ran about 20 Missions got roughly 18 more right than students who ran just one (+0.94 points per Mission, p < .001).
They engaged more
Students who ran Missions were more engaged in class than students who didn’t (g = 0.173, p = .009).
It holds up
Mission.io meets ESSA Level II standards, as validated by Instructure. Level II, Moderate Evidence, is the second-highest of the four evidence tiers in federal education law.
The headline study
What 1,039 fifth graders showed us.
In 2025-26, Instructure compared fifth graders who ran Missions with fifth graders who didn’t, across 53 classrooms in a large public district.
Knew more.
52% vs. 45% correct
Mission users vs. non-users
g = 0.335, p < .001 · +0.94 percentage points per Mission (p < .001)
Wrote better.
2.69 vs. 2.39
Mission users vs. non-users, 6-point rubric, independent raters
g = 0.269, p = .015 · climbs per Mission (p = .049)
Engaged more.
Significant
Mission users vs. non-users
g = 0.173, p = .009
Every Mission moved the number.
+0.94
Percentage points of content knowledge per Mission completed (p < .001). The strongest dose signal in the study.
Writing followed the same pattern, climbing +0.035 rubric points with every Mission (p = .049).
+0.94 percentage points of content knowledge per Mission (p < .001). Writing also climbs per Mission (p = .049).
Students who ran about 20 Missions scored roughly 17.9 percentage points higher than students who ran one.
How the study was built
- Design
- Quasi-experimental, with a full comparison group
- Sample
- 1,039 students, 53 classrooms, one large public district
- Measures
- Independent engagement scale; state writing rubric scored by independent raters
- Standard
- Meets What Works Clearinghouse baseline equivalence standards
Bautista, J., Henschel, M., & Allen Green, E. (2026). Mission.io and fifth grade learning outcomes: An ESSA Level II efficacy study, 2025-26. Instructure.
The part your district’s research office reads first.
It’s on its way.
Check your inbox.
That didn’t send. Try again, or write to info@mission.io and we’ll send the study.
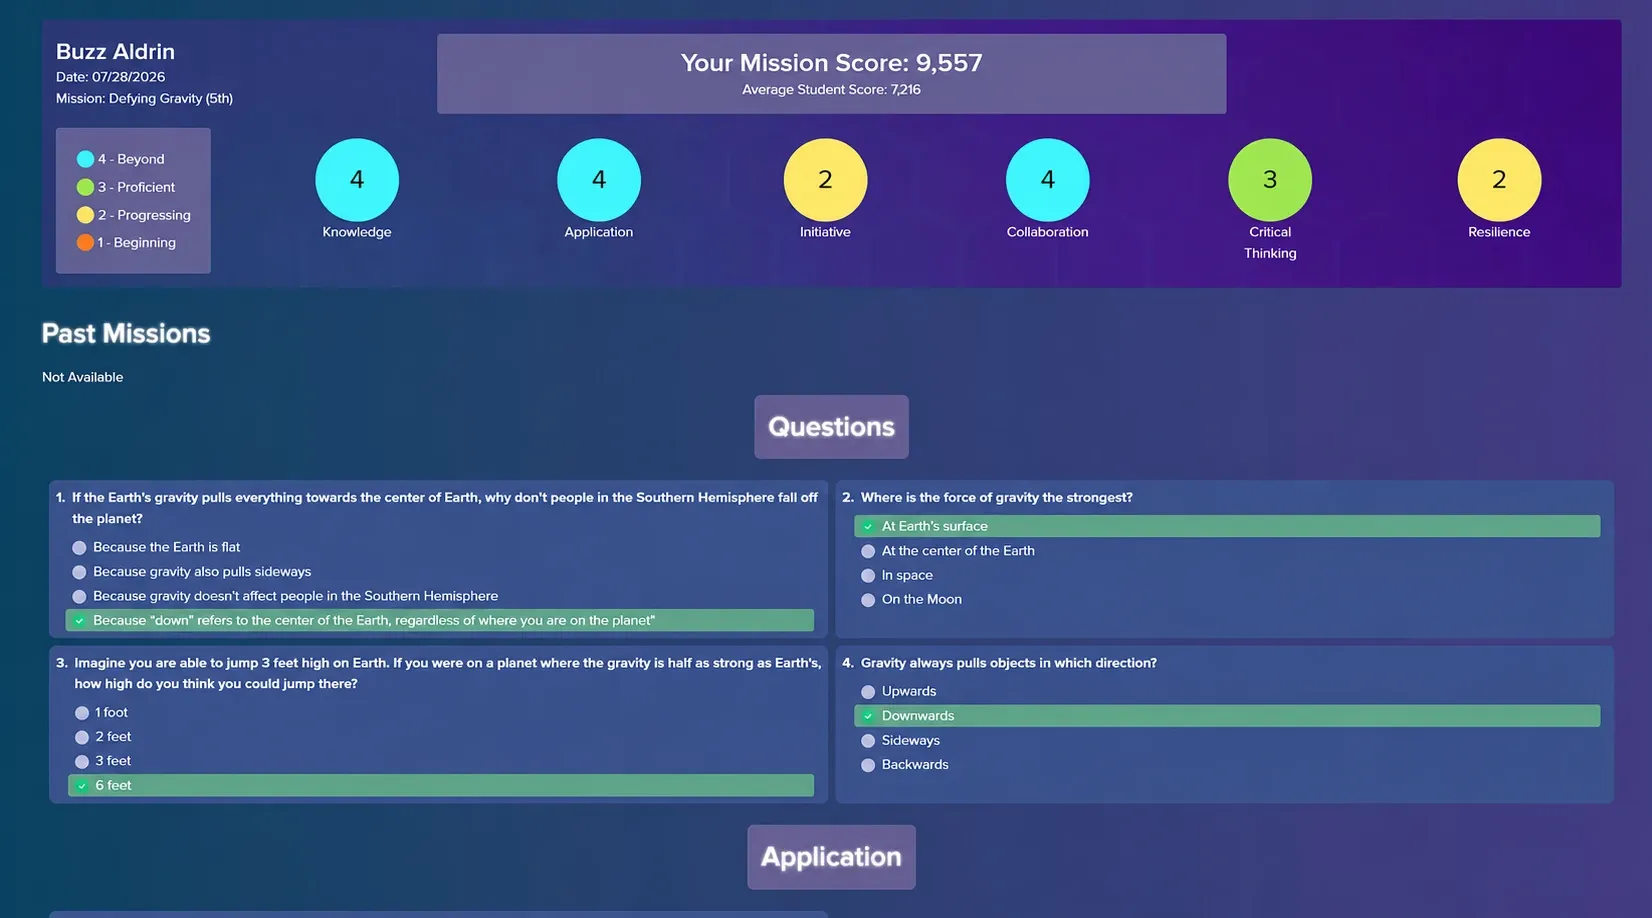
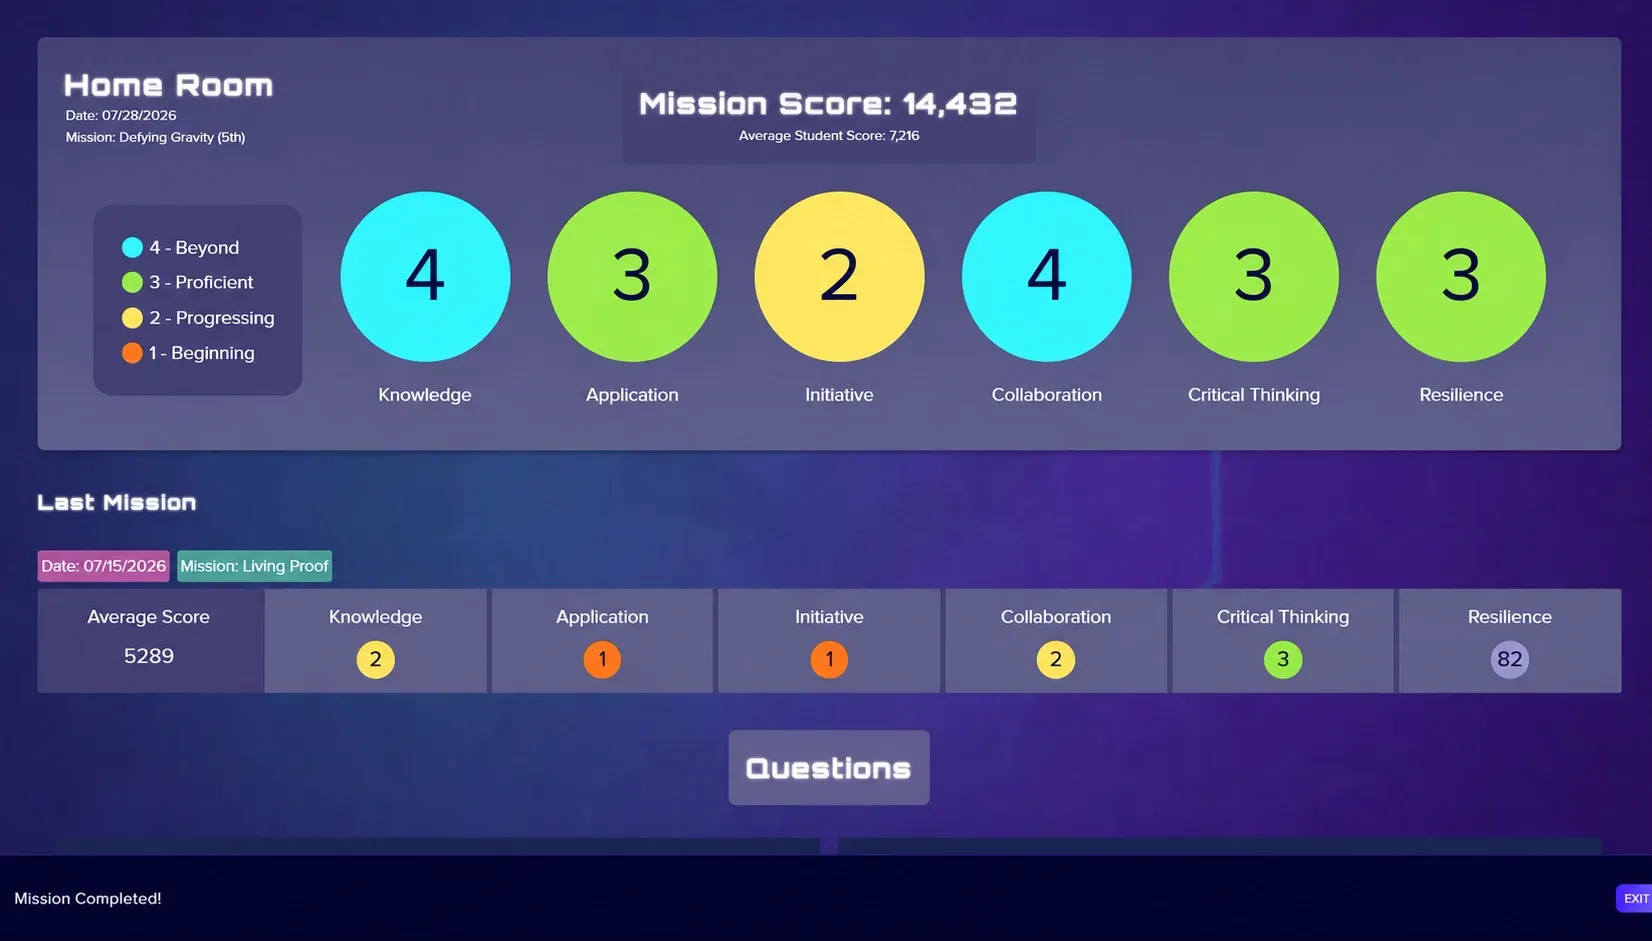
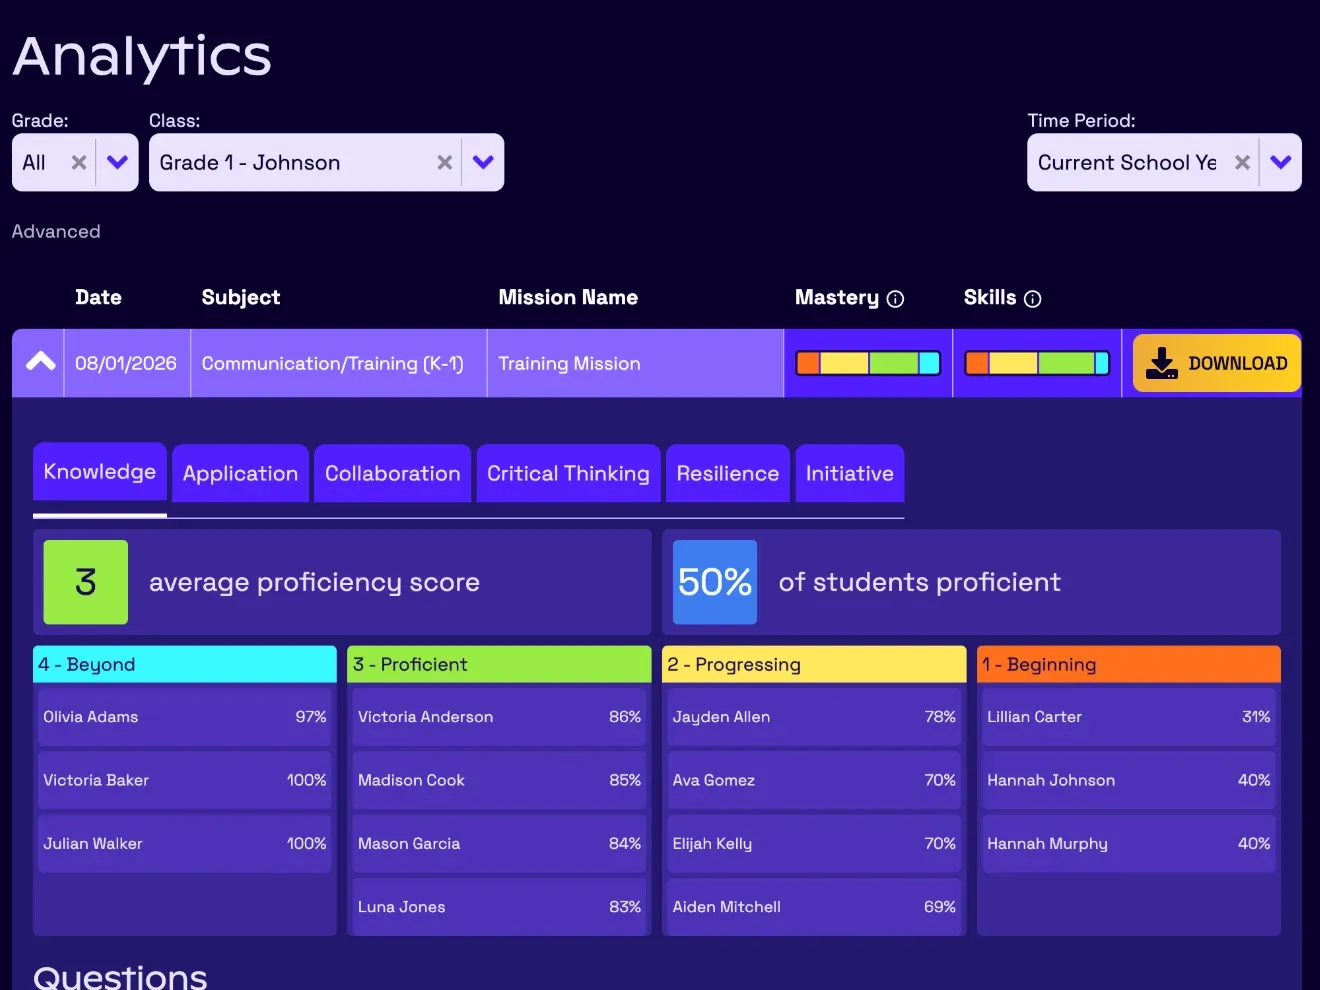
Every student gets a report on how well they did.
A test shows what a student remembered. A Mission shows what they can do with it. Each student’s report rates how well they used what they learned in the unit, and the human skills it took to get through.
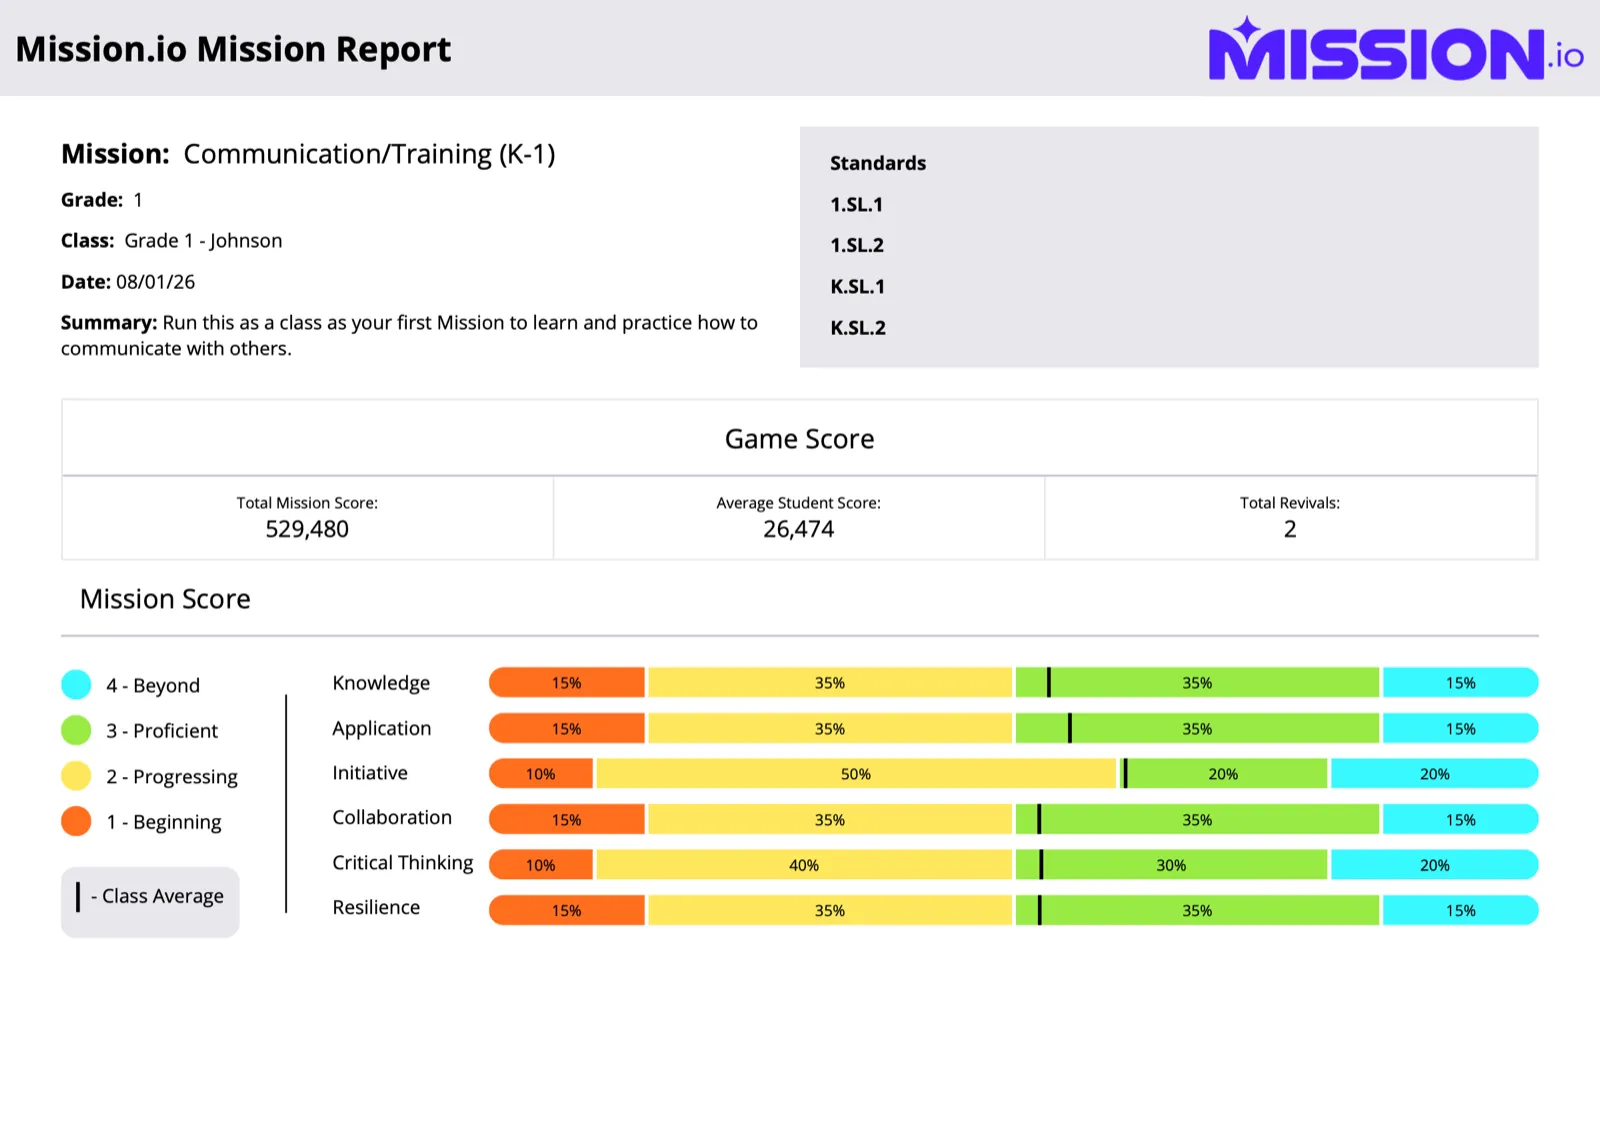
Including the quiet one in the back row.
What a report draws on
What they know
Knowledge. What they know about the content the Mission is built on. Application. Using that content to solve the problem in front of them.
Human skills
Initiative. Stepping up to make decisions and move the team forward without waiting to be told. Collaboration. Sharing information, building on each other’s ideas, and backing up teammates. Critical Thinking. Weighing the evidence and reasoning to a conclusion the team can defend. Resilience. Keeping at it when the problem pushes back.
Each report covers the skills that Mission is built to capture.
“After we have learned about a standard my students are able to apply their acquired knowledge to complete a mission together... Their skills of communication and teamwork have increased immensely.”
What the reports have shown
In Utah’s largest district, platform-measured collaboration rose from 46% to 85% over three years.
Mission.io. (2026a). District-wide, multi-year implementation of Mission.io in Alpine School District [Case study]. Mission.io.
Separately, across 380 schools and 12,613 records, platform data showed collaboration and critical thinking growing over the school year.
Langford, P. (2023). Impact of systematic program usage on development of socio-emotional skills (2022-2023). Mission.io.
Students engaged more. Independent researchers measured it.
Instructure’s researchers measured engagement on a validated scale. That result is what earned the study ESSA Level II, Moderate Evidence.
Behavioral engagement, students who ran Missions vs. those who didn’t: g = 0.173, p = .009 (Bautista et al., 2026).
Doesn’t clear the Level II bar
A rationaleTestimonialsA satisfaction survey
We have all three. None of them earned Level II.
Clears it
A well-designed, well-implemented quasi-experimental study with a statistically significant favorable effect.
The validator. Instructure conducted the study and formally validated it against the ESSA criteria in June 2026. Their name is on the report next to ours.
What’s next. Our research base met ESSA Level IV standards in 2024. The 2026 study earned Level II. Now a federally funded Education Innovation and Research project with Northeastern Utah Educational Services is underway, building to a large-scale randomized controlled trial.
ESSA Level IIModerate evidence (2026)

ESSA Level IVDemonstrates a rationale (2024)
10 of 10
Level II indicators met when Instructure validated the study against the ESSA criteria, June 2026.
It’s not just one study.
Here, the fine print is a button.
Science, Utah’s largest district
62.9% vs. 53.6%
Schools that ran 10 or more Missions posted higher state science proficiency than schools that ran none.
9.3 percentage points, d = 1.00, p = .003. Composite, Grades 4 to 6. Correlational.
Methods: Science, Utah’s largest district
In Utah’s largest district, across 60 schools and three years, schools running more Missions posted higher state science scores: Grade 5 r = .239, p = .001; Grade 6 r = .229, p = .002. The composite association held after controlling for economic disadvantage, minority enrollment, school size, and academic year. Schools that ran 10 or more Missions outperformed non-using schools across Grades 4 through 6, a 9.3-percentage-point composite gap (d = 1.00, p = .003).
Mission.io. (2026b). Mission.io usage and elementary science proficiency: A correlational study of Alpine School District from 2021-2023. Mission.io.
Literacy
Grades 3 & 5
Students who ran Missions made significant gains in reading and data analysis.
Gr 3: Z = −3.961, p < .001; Z = −3.429, p = .001. Gr 5: Z = −2.567, p = .010; Z = −3.814, p < .001
Methods: Literacy
In a quasi-experimental study funded by the U.S. Department of Education’s Institute of Education Sciences, across six Utah elementary schools and 240 students, third graders made significant gains in reading (Z = −3.961, p < .001) and data analysis (Z = −3.429, p = .001), and fifth graders did the same (Z = −2.567, p = .010; Z = −3.814, p < .001).
Milien, C., Langford, P., Abbott, J., & Haruch, M. (2025). Evaluating the impact of Mission.io on student engagement and literacy outcomes [Manuscript submitted for publication].
Teacher reports
96.1%
of teachers report Mission.io increases student engagement and participation.
Spring 2025 survey, n = 127, teacher-reported
Methods: Teacher reports
In the Spring 2025 satisfaction survey (n = 127), 96.1% of teachers report Mission.io increases student engagement and participation.
Mission.io. (2025). Customer satisfaction survey results for Spring 2025. Mission.io.
Recommendation
75.6 vs. 61
Teachers recommend Mission.io more readily than customers recommend the average tech company.
Net Promoter Score vs. the 2024 technology-industry average, n = 127
Methods: Recommendation
In the same survey, Mission.io’s Net Promoter Score of 75.6 beats the 2024 technology-industry average of 61.
Mission.io. (2025). Customer satisfaction survey results for Spring 2025. Mission.io.
Students show up for it. Teachers enjoy leading it.
- A Mission90
- Science labs82
- Field trips68
The kind of classroom experience teachers rate above a field trip.
Teacher-reported. Spring 2026 Teacher Experience Survey, n = 101.
56%
would spend a free block on a Mission. More than three times the next option.
Spring 2026 Teacher Experience Survey, n = 101, teacher-reported.
“This is the only thing I’ve used in 24 years of teaching that I love just as much as my students do.”
Evelyn Fowles6th grade teacher 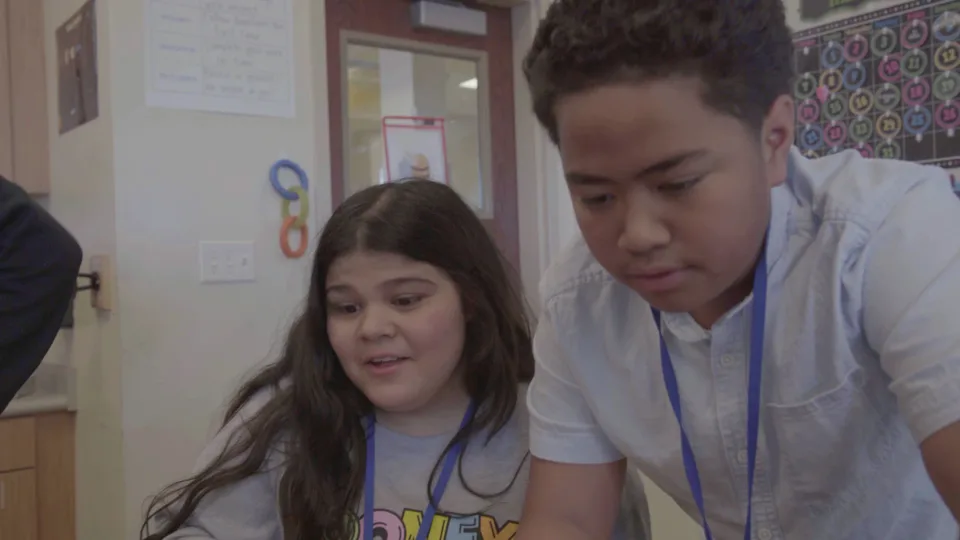
“I was on the floor in disbelief. My students were all participating and all engaged. They were cooperating as a whole team and helping one another.”
Lisa PerryTerra Academy, UT “Students are actively engaged, collaborating, and problem-solving in ways I have never seen before.”
Lauralee WardCoach, Alpine School District, UT “I hear some amazing discussion and debate when it comes time to make critical decisions for the mission... They learn so much and have such a blast. The missions are entertaining even for the teacher!”
Lindsay MaloufCedar Ridge Elementary, Alpine School District, UT
Nine years of federally funded R&D.
Federal research grants are competitive, and outside experts review every proposal. Nine years of them means the Missions you run stand on research we had to defend, year after year.



Older than this year’s kindergartners.
- 2017-19
National Science Foundation SBIR Phase I: the first whole-class Missions
- 2019-23
National Science Foundation SBIR Phase II: measuring each student’s skills across the whole Mission
- 2022-23
Usage analysis across 380 schools, 107 districts, and 19 states
- 2023-24
U.S. Department of Education’s Institute of Education Sciences, Phase IB: literacy, and our first quasi-experimental study
- 2024
Research base meets ESSA Level IV standards, as validated by Instructure
- 2024-26
U.S. Department of Education’s Institute of Education Sciences, Phase II: the efficacy study
- 2026
ESSA Level II, Moderate Evidence, as validated by Instructure
- 2026 onward
Education Innovation and Research grant: an implementation study, then a large-scale randomized controlled trial
Open invitation
Put us under the microscope.
Schools and districts join us as research sites. Grad students hunting for a thesis and post-docs looking for a study are welcome too. If you want to study whether this works, we’d love to partner with you.
Bring your toughest committee member.
Got it.
A real human replies within one school day.
Now back to that literature review. We’ve got this one.
That didn’t send. Try again, or write to support@mission.io and we’ll take it from there.
Common questions
Is Mission.io evidence-based?
Yes. Mission.io meets ESSA Level II standards, as validated by Instructure. An independent quasi-experimental study of 1,039 fifth graders found statistically significant gains in content knowledge (g = 0.335, p < .001), writing performance (g = 0.269, p = .015), and behavioral engagement (g = 0.173, p = .009). In knowledge and writing, gains grew with every Mission run.
Content knowledge +0.94 percentage points per Mission (p < .001); writing +0.035 rubric points per Mission (p = .049). Bautista et al., 2026.
What does ESSA Level II mean?
The Every Student Succeeds Act sorts evidence into four levels. Level II, Moderate Evidence, requires at least one well-designed quasi-experimental study with statistically significant favorable findings.
What does Mission.io measure?
Every Mission gives every student a report on how well they did, built from each student’s behaviors and performance across the whole Mission. Reports draw on six competencies (Knowledge, Application, Initiative, Collaboration, Critical Thinking, and Resilience), covering the ones each Mission is built to capture.
Who conducted the research?
Instructure, the company behind Canvas, conducted and authored the 2025-26 efficacy study, funded by the U.S. Department of Education’s Institute of Education Sciences. Earlier development was funded by the National Science Foundation. Mission.io’s own research team conducted the other studies on this page.
Can I read the full study?
Yes, and it’s free. Leave your email on our Evidence page and we’ll send you the full report and its ESSA validation. More research is underway, building to a large-scale randomized controlled trial through a federal Education Innovation and Research grant. GET THE FULL STUDY →
Students dig in, and the research holds up.
With every Mission they ran, students knew more and wrote better, and every student gets a report on how well they did. Start with one classroom or all of them.
Content knowledge +0.94 percentage points per Mission (p < .001); writing +0.035 rubric points per Mission (p = .049). Bautista et al., 2026.
Last updated